Tuesday/Wednesday blog
Making a molehill look like a mountain?
There was a well-known book published in 1954 titled HOW TO LIE WITH STATISTICS:
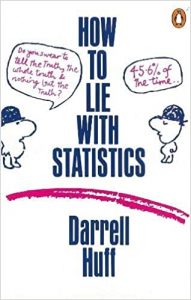
I haven’t read it. But apparently one of the warnings given in the book was:�Always Look at the Axes on a Chart
Adjusting the axes of a graph to make a point is a classic technique in manipulating charts. As a first principle, the y-axis on a bar chart should�always�start at 0. If not, it�s easy to prove an argument by manipulating the range, by, for example, turning minor increases into massive changes.
Here’s an illustration of how a y-axis�that uses a non-zero starting point can completely change the impression we get from a simple chart. The first graph (on your left) suggests interest rates are rising dramatically. But, when plotted in the full context of the data (on your right), the rise in interest rates does not look concerning at all:

The left-hand graph makes an apparent mountain of what is actually a rather insignificant molehill.
How to terrify the statistically-challenged
This same process has been repeatedly and successfully used with supposedly catastrophic global warming
Here’s the kind of chart we’re usually shown to terrify us about the impending Global Warmageddon:

For the moment we’ll leave aside the question of whether there can actually be such a thing as average global temperatures. After all, there were limited temperatures measurements in many areas of the planet up till satellites were used in the mid-1970s. Since then there have been (I think) three generations of satellites all giving slightly different results. Moreover, satellites don’t actually measure�temperature directly. According the that (not always reliable) fount of all knowledge – Wikipedia – satellites measure radiances in various wavelength bands, which must then be mathematically inverted to obtain indirect inferences of temperature. (Whatever that means)
But let’s assume the chart above is a reliable measure of global temperatures (which it most definitely is not). It looks pretty frightening. Global temperatures seem to be shooting up, threatening us all with imminent disaster – heatwaves, fires, extreme weather, collapse of agriculture, starvation, extinction of mankind (and womankind and transkind and all the other 57 or so genders). But if you look a bit more closely at the y-axis, you’ll see it measures the global temperature deviation from the 1951-1980 average in units of 0.5�C. The chart doesn’t show actual temperatures.
Moreover, the apparently horrifying rise in global temperatures is actually only around 1�C in 140 years from 1880 to 2020 or 0.7�C per century.
Here’s what the same chart of global temperatures would look like if the y-axis started at zero:

Now that doesn’t look too frightening at all. And that’s why the climate-catastrophists never dare show us temperature charts where the y-axis starts at zero. Instead, we get highly manipulative presentations of data which rely on our ignorance in order to frighten us into submission to the ever-increasing coercive restrictions which are being imposed on us to supposedly save the planet
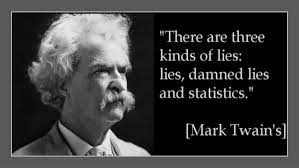
As someone much cleverer than I could ever be said:
This sporting life
To finish off, two short sporting stories.
Firstly, we’re now informed that the Scottish Cricket Board members have all resigned after a new report accused them of that old favourite – institutional racism. I’m confused. Firstly, because I didn’t know anyone in Scotland actually played cricket. I thought cricket was a game for the hated English. And secondly, the Scottish population is 96% white. So it must be difficult to find any of our coloured friends to be racist against.
Talking of supposed ‘racism’, here’s the English women’s football team currently competing in the Euros:
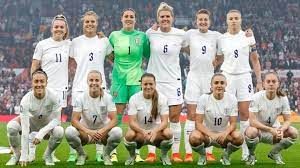
Apparently some BBC reporter has been moaning and blubbing about the fact that they’re all white. I guess that’s more ‘institutional racism’?
Here’s another nice sporting photo. This one features the US, Canadian and UK’s men’s relay teams who came first, second and third at this week’s Oregon world athletics championships:

But we didn’t hear the BBC complaining about the skin colour of these twelve athletes. I wonder why not?


We often discuss more complex issues but the simplicity of this beats them all. I wonder how many school teachers point this out to their pupils when they talk about climate change. There is an additional point with temperatures which is that thermodynamics uses the Kelvin scale and therefore it should use absolute zero.
Al Gore pulled another trick in �Inconvenient Truth� about the relationship between CO2 and temperature. He separated the two graphs, put temperatures above CO2, put them on a wall and used a lift to enable him to point to the very high temperatures. When he put this in a document for schools he turned the graph around, starting with the present dates on the left.
Thomas Sowell has talked about basket ball teams and why there are no short men in them. It�s because they want a team that will win. It really is time the BBC was closed down.
When I looked at the photograph of the men’s relay teams I have to admit that for a second I assumed these chaps had been competing in some sort of a Jazz band competition and were looking forward to spending their winnings and returning home, laden with grain for the whole village. I did wonder if the Robertson Jam people were somehow at the back of all this.
It turns out that they were simply chosen because they can run fast. A bit racist to white folks like me, methinks.
The BBC has filled itself up with mental whites, who are mainly females now, who resent their own kind to an insane degree. This must be because the history books are dominated by the accomplishments of Europeans.
Apparently, theses social justice warriors resent the fact that all of the scientific standards and measurements are named after the white men who discovered the science behind them. Apparently, this is racist because it makes the non-whites studying science feel inferior and so they should be changed as soon as possible to make them race and gender neutral..
Therefore it is only logical that theses warriors for social justice are trying their best to use the people with the least history to falsify the history of the people who have the greatest history – Europeans.
According to the BBC, the wife of Henty VIII, Anne Boleyn, was a black woman. Has anyone tried to get hold of Henry in a s�ance in order to find out what he thinks of that?
That is obviously only the start. Soon even Elizabeth I, Elizabeth II, Barbara Windsor, Margaret Thatcher, Princess Diana and Terry Thomas will be played by black actors.
Here is Simon Webb’s take on the BBC’s obsessive interest in one-way lack of diversity.
Apparently black Africans – both males and females – have 15% more testosterone than white people. All human females have levels of testosterone.
A disturbing lack of diversity at the World Athletics Championships�
Tony Heller produced an excellent video a few months ago in which he demonstrated how the Climate Change Catastrophists unashamedly indulge in selective use of start dates in order to in effect falsify for their propaganda purposes the apparent rate of “anthropogenic climate change”. The infamous Hockey Stick graph was amongst the most flagrant examples of misrepresentation. Just what are we, in scientific, mathematical and statistical terms, teaching our young people when the “academic elite” from our top universities indulge in such distortion of data? Nearer home, do we perhaps catch just as glimmer of hope in Liz Truss, who if the current polling of Conservative Association membership is any indication, is set to become the next PM? It seems she is preparing to take on the challenge of getting our enfeebled, rainbow-helmeted police off their obsession with policing “hurt feelings” and back to dealing effectively with escalating real crime – burglary, theft, stabbings, rape, domestic violence. Let, though, those of us who are still rational and have some understanding of history, take comfort. “What goes round, comes round”. History repeats itself. Culture has always veared between periods of overindulgence and narcissism to periods of severe self-imposed restraint and flagellation. The periods of change between these extremes are both stimulating and disruptive. It seems to me that right now in the developed West we are at the peak of a period of extreme narcissism and physical and emotional self-indulgence. I predict that as financial austerity truly comes to bite almost everhone, even the most self-indulgent, a change to greater rationality will commence.