(Tuesday to Thursday blog)
Regular readers will know that I’m pretty busy writing a new book THERE IS NO CLIMATE CRISIS.
I hope to have the first draft ready in about 3 weeks. Then I have to decide whether to try to sell the book to a publisher or to just pay to publish it myself. Whether my book is genius or rubbish or somewhere in between, I suspect no publisher will dare take it as they’ll be terrified of being attacked by the cyber-pitchfork-wielding woke mob for telling the truth – rising CO2 is not causing any catastrophic global warming or climate change or climate emergency or climate crisis or whatever it’s called this week.
Anyway, I thought it might be worth using this blog to give just one tiny but significant example of the kind of lies the whole climate change panic is built on.
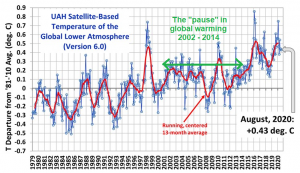
Here’s a temperature chart showing that, in spite of ever-rising atmospheric CO2, there was a 12-year pause in global temperature rise between 2002 and 2014:
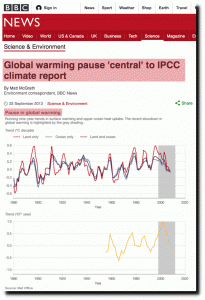
But can we trust this chart? After all, with the climate change cult continually tampering with the figures, you can find climate charts ‘proving’ whatever you want. Well, in this case, we can trust this chart as even the lying, climate-catastrophist Bolshevik Broadcasting Corporation reported the pause at the time. Here’s the proof:
But this ‘Pause’ posed a problem for the climate alarmists. How could rising atmospheric CO2 be driving warming, if CO2 kept rising while temperatures didn’t change for 12 years? Moreover, there was a further problem for the lying climate catastrophists. Increasingly there is evidence that variations in solar activity (and not rising CO2) may be the main driver for the Earth’s changing climate.
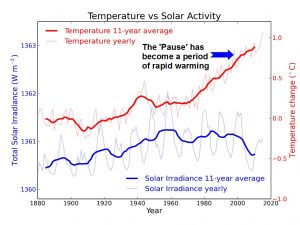
To solve these two slight difficulties with their bogus CO2-driven warming cult, the climate catastrophists came up with a simple solution – they falsified the temperature data to remove the ‘Pause’ (which we know happened and which even the BBC admits happened) and replaced the ‘Pause’ with ever-rising temperatures:
So, magically there was now no ‘Pause’. Plus, by deceitfully drawing in ever-rising temperatures in the place of the ‘Pause’, the climate catastrophists could ‘prove’ that there was no link between decreasing solar activity since the year 2000 and supposedly ever-rising temperatures.
This is just one of many small lies I will expose in my book. But hundreds of these small lies make up the biggest lie of all – that humans burning fossil fuels are altering the Earth’s climate and threatening the future of mankind.
And based on the farrago of lies, which I will expose in all its putrid horror, we’re about to close down our power stations, destroy what’s left of our industry, throw millions out of work, impoverish our people and hand control of the world to the lying, corrupt, plague-spreading Chinese.
Lemmings would be impressed by our collective suicide.








https://www.breitbart.com/europe/2021/01/18/china-coal-output-highest-since-2015-despite-green-pledges/
Interesting that China consumes 3.84 billion tonnes yearly. We in our wisdom paid Drax, our biggest most efficient coal burning power station, £789.5 million in subsidies in 2019 to enable it to burn wood from forests 3000 miles away rather than the 9 million tonnes of coal it was using annually from a coal mine a few miles away. That will do wonders for ‘Climate Change.’ The race to make this country zero carbon by 2050 continues relentlessly. Mike Travers in his pamphlet, The hidden cost of rewiring the UK, puts the final cost of our dash to renewables as £410 billion, (£15000 per household) to which must be added £56 billion cost of upgrading the distribution system (£2000 per household) Other expenditure will also be necessary. Heat pumps only work in well insulated and draught-proofed spaces, but the cost of retrofitting insulation measures is not considered here. Nor are the expected increases in the cost of electricity, or the cost of replacing thousands of distribution transformers, but these figures will certainly be significant.” So, guess which country will still be a thriving powerhouse come the year 2050?
https://docs.google.com/spreadsheets/d/1kXtAw6QvhE14_KRn5lnGoVPsHN3fDZHVMlvz_s_ch1w/edit#gid=165011444
As you know my interest is in the physics and I haven’t paid much attention to temperature records, partly because I don’t know who to believe. Tony Heller has done a lot to claim that temperature records are being falsified by lowering past temperatures and increasing present temperatures in the USA but I have never seen him give a reference to the data sources. He also uses a lot of old newspaper reports and I’m inclined to wonder whether the media was more reliable then compared with today. These claims have to be backed up with references to the data. One of the reasons given for adjusting data is harmonising (I think that’s the term) but why are they doing it years later? My view on measurements is if the measurement is not correct for some reason, then change the way it is measured so that it is correct and don’t adjust an incorrect measurement.
I’m seeing more claims of entering a colder period and it seems to be true with North America last year but will it continue and will it get worse? Darko Butina has done a lot of statistical analysis of temperatures and plotting them as a distribution rather than looking at meaningless averages. It is normal for temperatures to higher or lower but most of the time they will be around a mean value. Are we seeing a short period of more extremes or are lower temperatures a trend and getting worse? We know about the Roman warm period and little ice age but we had no temperature records. It would be interesting to know whether there are any written records that give clues about how quickly these past changes happened.
I suppose it is difficult to name the guilty westerners in your book, but Al Gore, Obama, Biden, Bill Gates, Clegg, Ed Miliband, Boris and the UN and EU mobs stand out. Then are scientists with Michael Mann, James Hanson and Brian Cox at the top of my list. Then the BBC, Sky News and The Guardian. However, one of the most influential in the UK must be the dreadful Attenborough and his propaganda. China can just sit back and wait when our enemies are within. But surely, the real problem is the ignorance and gullibility of the masses brought about by the declining education system.
There is another issue with temperature records and their relationship with models. The temperature that matters is the surface temperature because this is where the energy from the sun is absorbed. If you believe in back radiation and the greenhouse effect, the surface is also where this returning energy is absorbed. To model the physics the temperature in the models must be the surface temperature.
But when temperatures are measured the surface temperature is never measured. On land temperatures were measured using Stevenson’s Screens with the thermometer about 1.5m above ground level and usually in parks to avoid being on tarmac or concrete or near buildings etc which influence the temperature. These have been replaced with modern equipment, but I believe still at similar heights. It made sense to measure in parks, since most of the surface has not been built on. But when these measurements began, nobody was thinking of mathematical modelling. A lot of remote thermometers seem to have vanished from the records, so there a bias to higher temperatures being measured in urban areas.
70% of the earth’s surface is water and the temperatures are not measured above the sea, as with land. The sea temperature is measured. But all these measurements are combined as if they were consistent. It is known that past sea temperature records are not even consistent. Originally wooden buckets were used to get the sample and then metal. With a metal bucket it is known that the temperature falls quickly before there is time to take the temperature. Then the temperature was measured at ship sea water intakes. A summer swim in the sea will reveal how the temperature drops below the surface, so what temperature do these measurements represent? Not the temperature that the sun heats the surface.
Now we have satellite measurements. I don’t know much about these, but I understand they are measurements of radiation from isotopes of oxygen which are then converted into a temperature. These are not the surface temperature but an average through a depth of the atmosphere which I believe to be about 1km. I might be wrong about some of this. But how do these temperatures relate to surface measurements and the temperatures calculated in models?
I have a feeling that the liberal globalists behind the climate-change and green agendas are expecting that the populations in the western countries are going to be very much lower by around 2030 than they are now. Reduced by as much as half by their other agendas – Codid-19 (the bait) and the continuing vaccinations (the hook and line).
The following is what Dr Kary Mullis, the Nobel-prize-winning biochemist who invented the PCR test that is in use to test for Covid-19 said about it before He died in 2019,
just before Covid-19 hit the scene. “Anyone can test positive for practically anything with a PCR test, if you run it long enough… with PCR if you do it well, you can find almost anything in anybody… it doesn’t tell you that you’re sick.” – Dr. Kary Mullis.
In short, the higher the amplification rate of the PCR and lateral flow tests, the more positive test results are achieved and vice versa. The lower the amplification rate the lower the number of positive test results. He is interviewed about his PCR test in the following video.
PCR: Past, Present, and Future –
There is a relevant piece today by Tony Heller on temperatures which you might have seen:
http://newtube.app/user/TonyHeller/JnaTzlS
It is about ice melting in a cave where WWI artefacts have been found. This is being promoted as a global warming issue, but as Heller points out the cave was obvious ice free when it was used and hence it was warmer than today in that area.
It might be interesting to follow it up and look for temperature records in the area. A different task I suspect.
That’s a long video from Brenda. I’ve seen shorter ones with his comment about the process. I’ll listen to it all at some point but I don’t have the background to understand the detail.
In relation to this I’ve seen conspiracy theories saying Mullis was killed so that he could not expose the problems with PCR testing. More relevant are claims from a laboratory in California that they tested samples said to contain the coronavirus and only found Influenza A and B. The laboratory is not named and no paper has been published.
It’s just the same as climate science, somebody is lying, but how do know who and what can we do about it anyway?
Here is the shorter YT video that I got my quote from.
Kary Mullis Explains Why His PCR Tests Don’t Work on Viruses –
https://www.youtube.com/watch?v=jTRk7pyGOBU
My first link originally went to that video but it was bypassed and went to the long video. Probably Google funny business.
There is something else that needs thought. If the PCR tests cannot be used to detect a virus infection, what are the tests, if they are taking place, being used for? – The collection of identifiable DNA? Maybe to personalise vaccine updates just as Google, Facebook, etc., and want to personalise everything you do on their websites.
When you get your DNA analysed at these ancestry sites, you are sent a kit and send in a swab for DNA analysis.
It looks as if people are keeping the short video going when YT does something to it.
One small but important thing you can do today is NOT TO VOTE FOR ANY OF THE 4 PARTIES.Vote independents or spoil your paper with appropriate verbiage.
There is one question that should be asked. Assuming that Climate Change is due to CO2, if the UK went zero CO2 what would the temperature difference be in 50 years.
Answer. Too small to be measurable.